Visual field simulation using optical coherence tomography and optical coherence tomographic angiography

Active Publication Date: 2020-09-17
OREGON HEALTH & SCI UNIV
View PDF0 Cites 3 Cited by
  • Summary
  • Abstract
  • Description
  • Claims
  • Application Information

AI Technical Summary

Problems solved by technology

However, VF testing is subjective, time-consuming, and poorly reproducible.
Thus it is difficult to clinically judge whether glaucoma is progressing rapidly or not based on OCT structural measurements.
Unfortunately, VF parameters and OCT-based NFL thickness parameters do not correlate well with each other.
This poses challenges in the staging and monitoring of glaucoma, given the potential for discordant functional and structural results.
In order to improve the correlation with VF_MD, it is insufficient to simply transform the overall NFL thickness from a μm to dB scale.
The agreement between NFL_MD and VF_MD are good in the PPG and early PG stages, however, NFL_MD still significantly underestimated VF damage in the moderate PG stage and markedly under-estimated VF damage in the advanced-to-severe stages.
While we could lower the bottom limit to extend the dynamic range of NFL_MD, this would significantly worsen the repeatability from NFL measurement noise.
Thus some remaining discrepancy in the advanced stages of glaucoma may be unavoidable.
On the other hand, error in NFL_MD could be introduced by image processing (

Method used


Image

  • Visual field simulation using optical coherence tomography and optical coherence tomographic angiography
  • Visual field simulation using optical coherence tomography and optical coherence tomographic angiography
  • Visual field simulation using optical coherence tomography and optical coherence tomographic angiography

Examples


example 1

g Visual Field Mean Deviation Using Optical Coherence Tomographic Nerve Fiber Layer Measurement in Glaucoma Patients

[0087]Purpose:

[0088]To construct an optical coherence tomography (OCT) nerve fiber layer (NFL) parameter that has maximal correlation and agreement with visual field (VF) mean deviation (MD).

[0089]Methods:

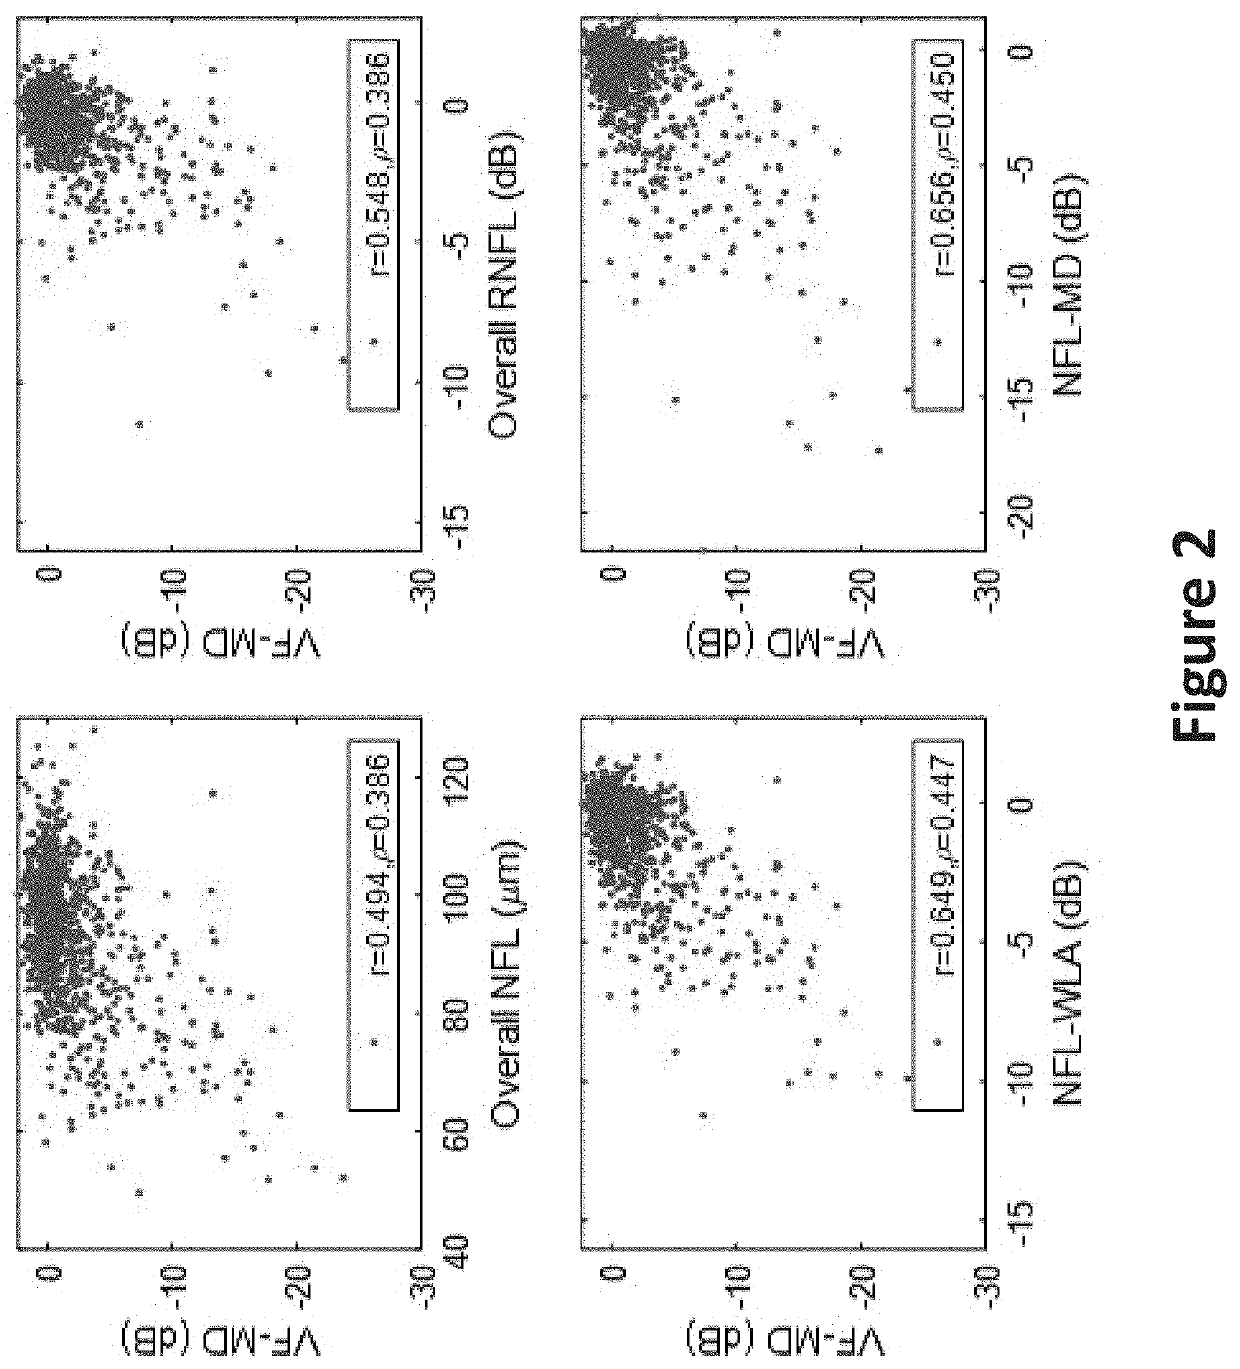
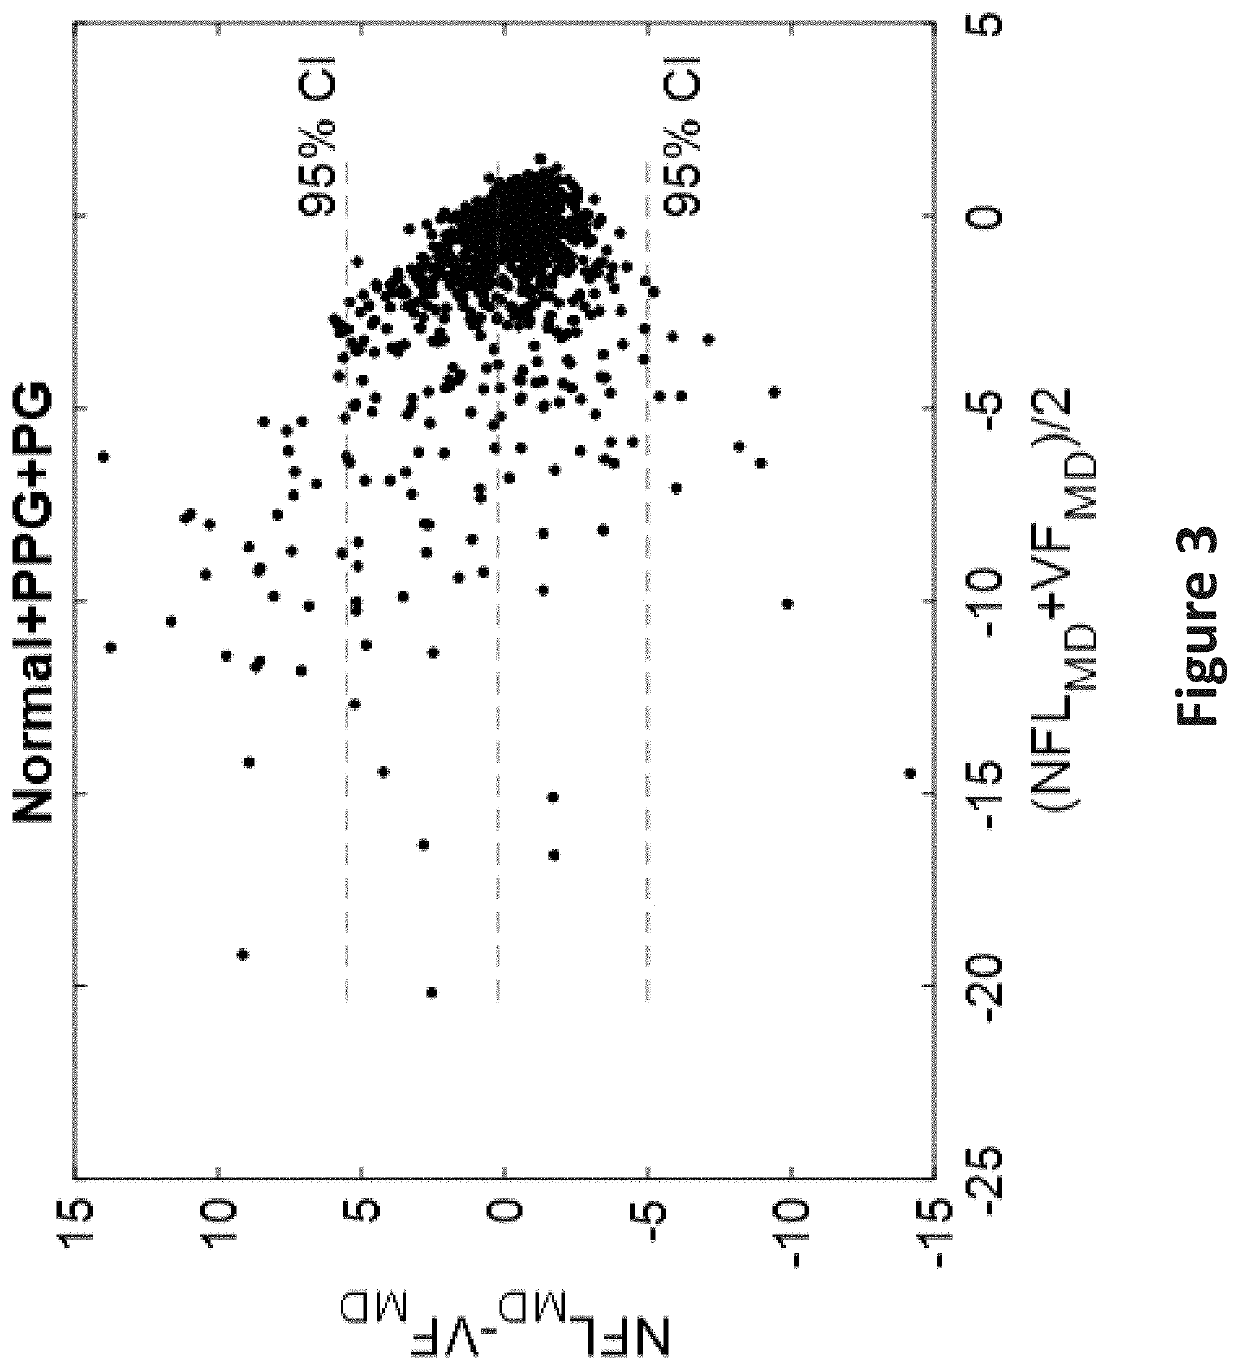
[0090]The NFL_MD parameter in dB scale was calculated from the peripapillary NFL thickness profile nonlinear transformation and VF area-weighted averaging.

[0091]Results:

[0092]From the Advanced Imaging for Glaucoma study, 245 normal, 420 pre-perimetric glaucoma (PPG), and 289 perimetric glaucoma (PG) eyes were selected.

[0093]NFL_MD had significantly higher correlation (Pearson R: 0.66 vs 0.49) with VF_MD than the overall NFL thickness. NFL_MD also had significantly higher sensitivity in detecting PPG (0.13 vs 0.08) and PG (0.59 vs 0.43) at the 99% specificity level. NFL_MD had better reproducibility than VF_MD (0.35 vs 0.69 dB, p<0.001). The differences between NFL_MD and

example 2

g Visual Field Mean Deviation Using OCT—Angiography

1. Introduction

[0159]Glaucoma is the leading cause of irreversible blindness worldwide. Early diagnosis and monitoring with appropriate treatment are necessary to prevent visual loss which is irreversible and usually becomes symptomatic only in its late stages. Current methods of assessing glaucoma and its progression have significant limitations. The visual field (VF) directly assesses function, but the testing is subjective, time consuming, and poorly repeatable. Quantitative imaging of the peripapillary retinal nerve fiber layer (NFL) with optical coherence tomography (OCT) provides a faster, more repeatable and objective assessment in the diagnosis and monitoring glaucoma. However, NFL thickness has only moderate correlation with VF parameters, and the correlation further deteriorates in the later stages of glaucoma due to the “floor effect.” Therefore, structural OCT NFL measurements perform relatively poorly in the monitoring of


PUM


Abstract

Disclosed herein are methods for simulating the results of a visual field (VF) test using an optical coherence tomography (OCT) system. The disclosed methods may utilize structural information extracted from OCT image datasets, such as thickness measurements, or may utilize functional information, such as blood perfusion measurements, extracted from OCT angiography (OCTA) image datasets. Other embodiments may be described and claimed

Description


Claims


Application Information

Patent Timeline
Owner OREGON HEALTH & SCI UNIV
Why Eureka
Try Eureka