Segregation-of-duties analysis apparatus and method

Inactive Publication Date: 2011-05-10
D2C SOLUTIONS
View PDF28 Cites 98 Cited by
  • Summary
  • Abstract
  • Description
  • Claims
  • Application Information

AI Technical Summary

Benefits of technology

[0007]To address these problems, the inventor undertook to develop a more intuitive interface for setting up the SOD analysis and for visualizing the results of a SOD analysis. In particular, he developed a user interface that uses Venn, Euler, or Veitch diagrams or derivatives or equivalents thereof to depict potential Segregation of Duty (SOD) problems or violations and unauthorized access across a business's Enterprise Resource Planning (ERP) applications. An interesting and insightful discussion of Venn diagrams is set forth in the following article, which is herein incorporated by reference: Frank Ruskey and Mark Weston, “Venn Diagrams,”The Electronic Journal of Combinatorics (edition dated Jun. 18, 2005).

Problems solved by technology

Over time, the originally well-designed internal controls implemented by a system can become outdated, creating new opportunities for fraud and abuse.
Furthermore, as a business grows into new areas, or as previously unanticipated abuses or internal control failures are discovered, businesses need to continually revise and refine their internal controls and develop new SOD mechanisms to prevent further failures.
As a company's internal controls grow more sophisticated and complex, the task of undertaking a SOD analysis grows exponentially more complex.
Standard methodologies for performing SOD analyses are tedious, cumbersome, and inadequate.
Some SOD tools provide numerous predefined SOD queries, but the process lacks an adequately visually intuitive or user-friendly interface for setting up the SOD analysis or visualizing the results of the SOD analysis.

Method used


Image

  • Segregation-of-duties analysis apparatus and method
  • Segregation-of-duties analysis apparatus and method
  • Segregation-of-duties analysis apparatus and method

Examples


Example

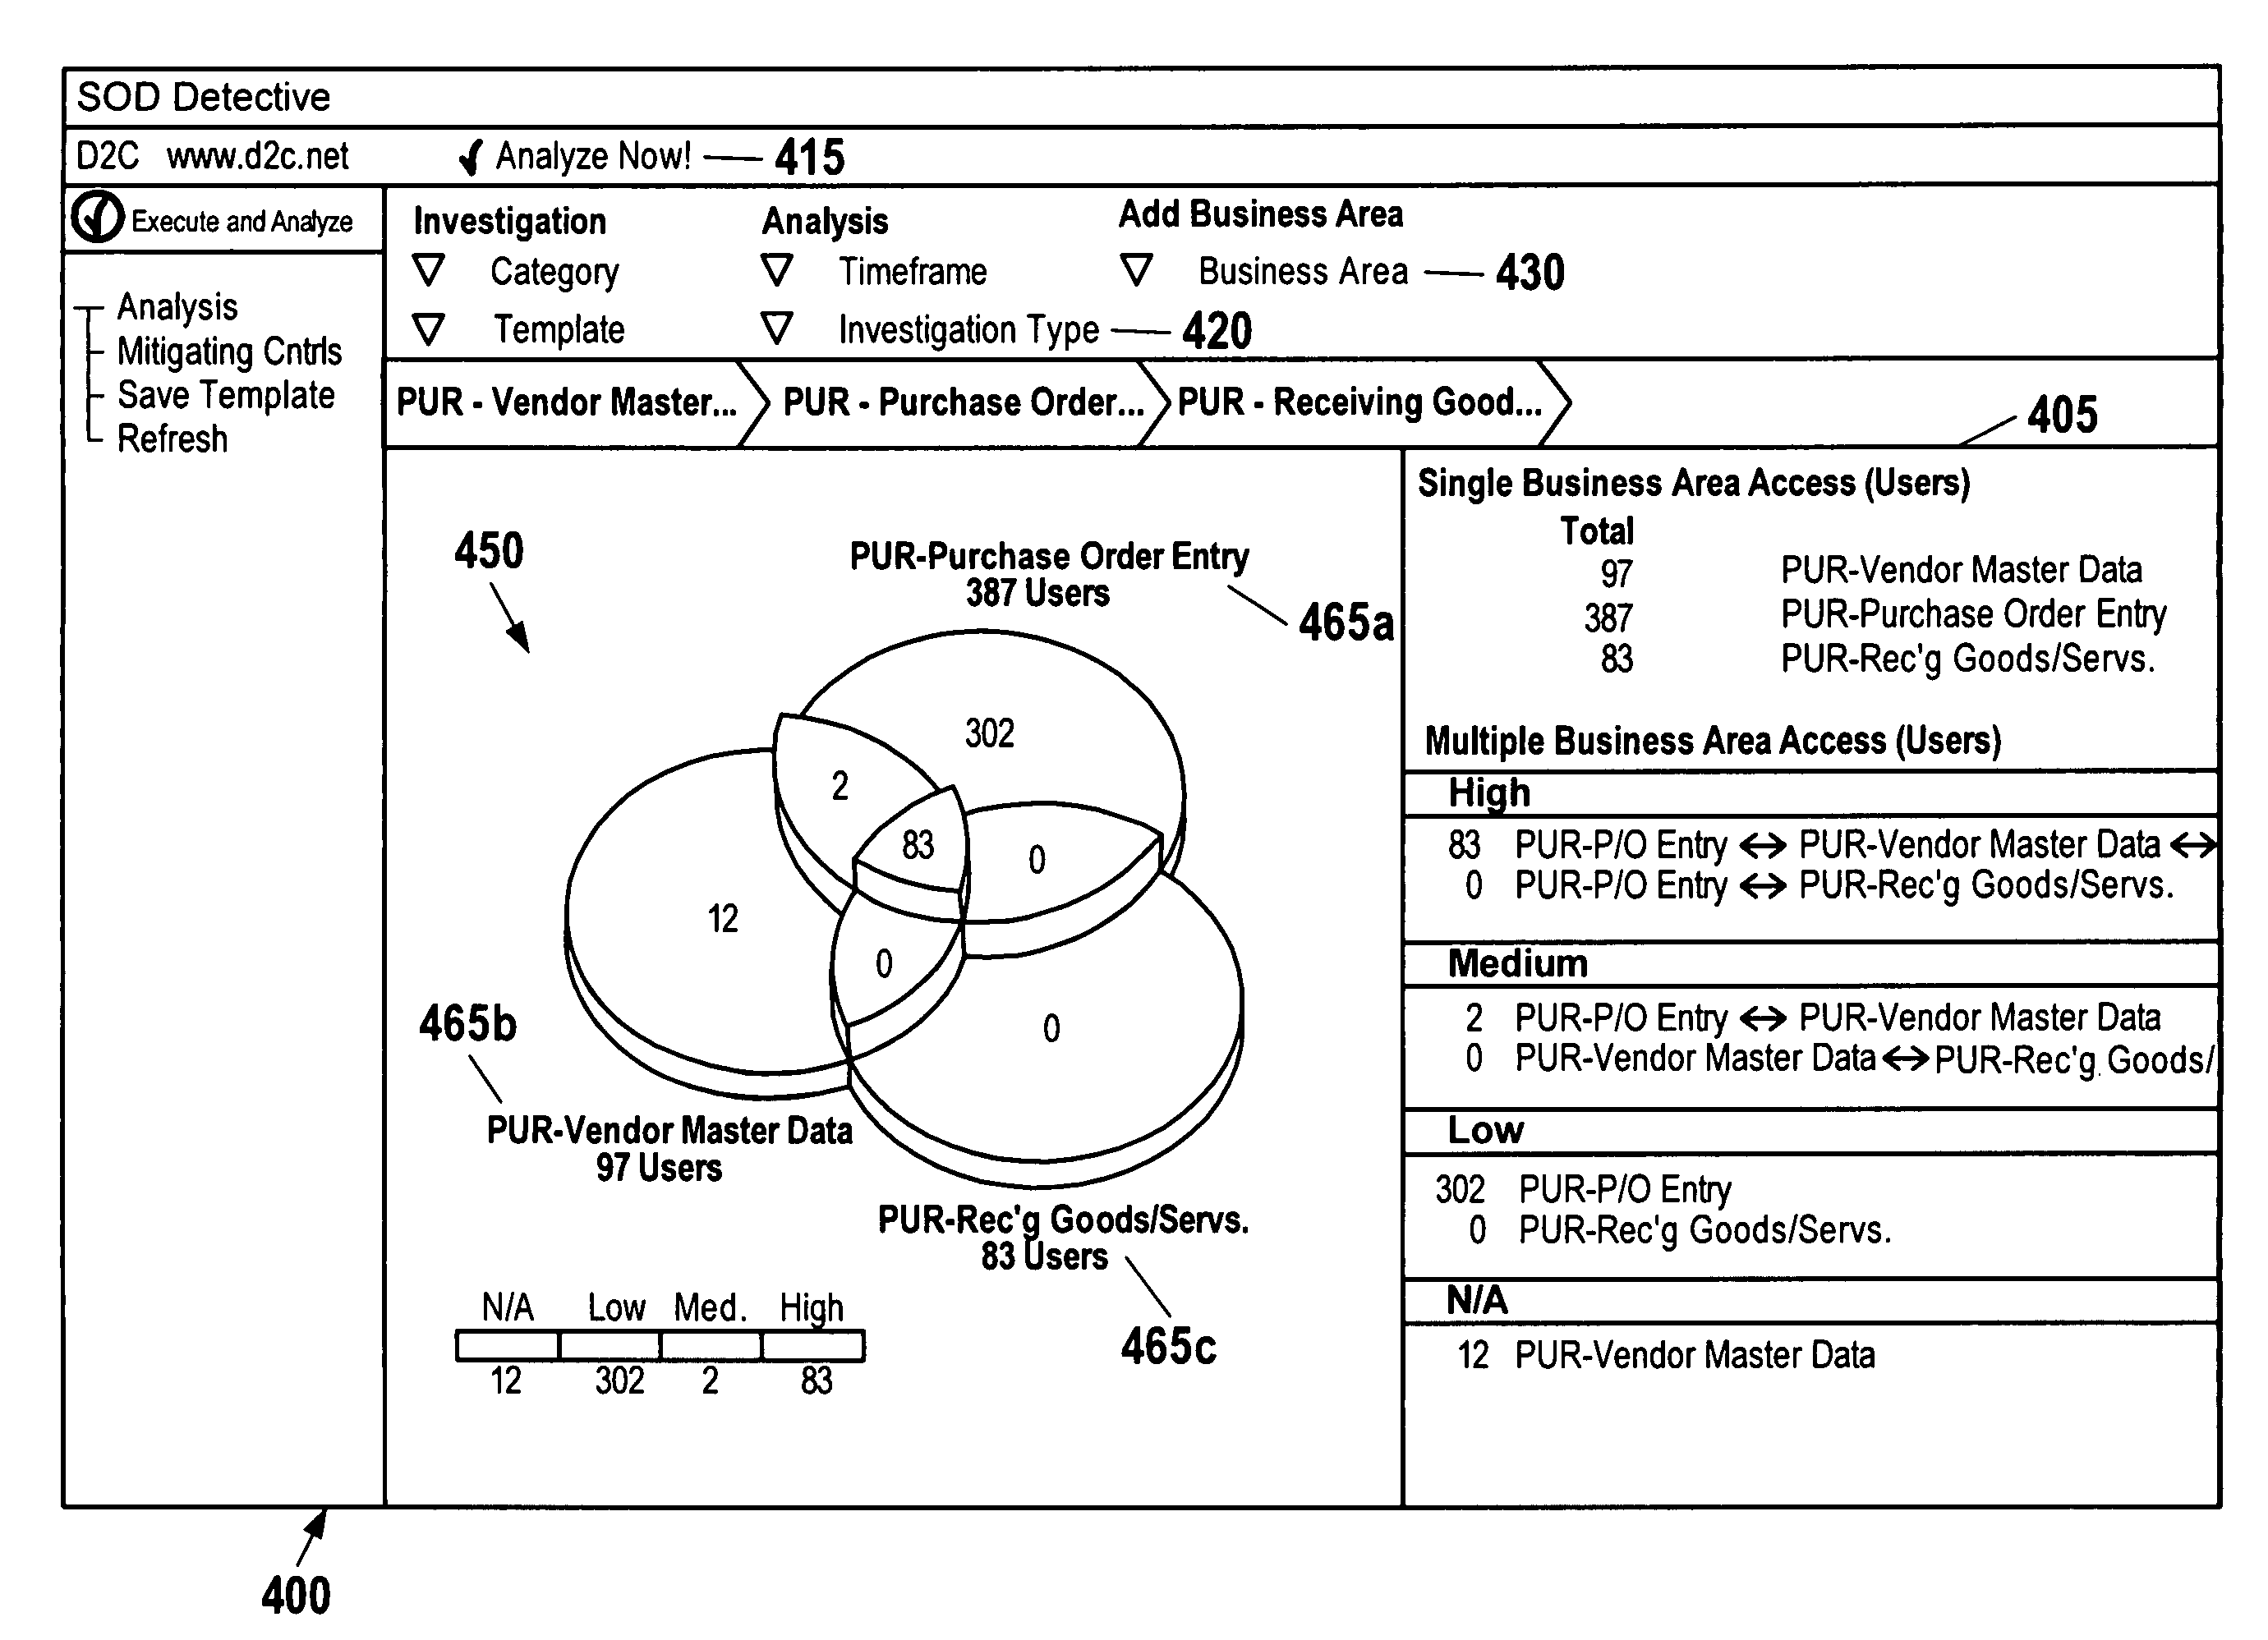
[0018]The present invention is directed to a method and system for SOD analysis that uses Euler or Venn diagrams—including variants such as Spider diagrams and Johnston diagrams—or their equivalents, such as Karnaugh maps, to depict potential Segregation of Duty (SOD) problems or violations and unauthorized access across a business's Enterprise Resource Planning (ERP) applications. It is contemplated that the SOD analysis will be carried out using a user interface running on an end user computer 910 (FIG. 9), which retrieves relevant data and data sets from a back-end server 950 storing the ERP database, and which interacts with a SOD analysis engine running on the end user computer 910 or, more preferably, a separate high speed computer 960 optimized for rigorous data crunching and analysis.

[0019]It is also intended that the current invention interact with typical ERPs, such as those systems marketed by SAP AG® headquartered in Walldorf Germany, Oracle Corp.® of Redwood Shores, Calif.


PUM


Abstract

A method and user interface for performing and displaying a segregation of duties analysis on an enterprise resource planning system or back office software system displays potential segregation of duty violations using selectable Venn, Euler, or Veitch diagrams.

Description


Claims


Application Information

Patent Timeline
Owner D2C SOLUTIONS
Why Eureka
Try Eureka