Method for quantitatively analyzing lactoferrin content by utilizing infrared spectrum
A technology of lactoferrin and infrared spectroscopy, applied in the field of food detection, can solve the problems of difficult quantitative analysis, complex detection background, and low content of lactoferrin
- Summary
- Abstract
- Description
- Claims
- Application Information
AI Technical Summary
Problems solved by technology
Method used
Image

Examples
Embodiment 1
[0017] (1) Taking whey protein solutions with mass concentrations of 1%, 2%, and 3% as the background, prepare 0.01%, 0.05%, 0.1%, 0.2%, and 0.3% mass concentrations of whey protein solutions with three different mass concentrations Lactoferrin standard sample solution.
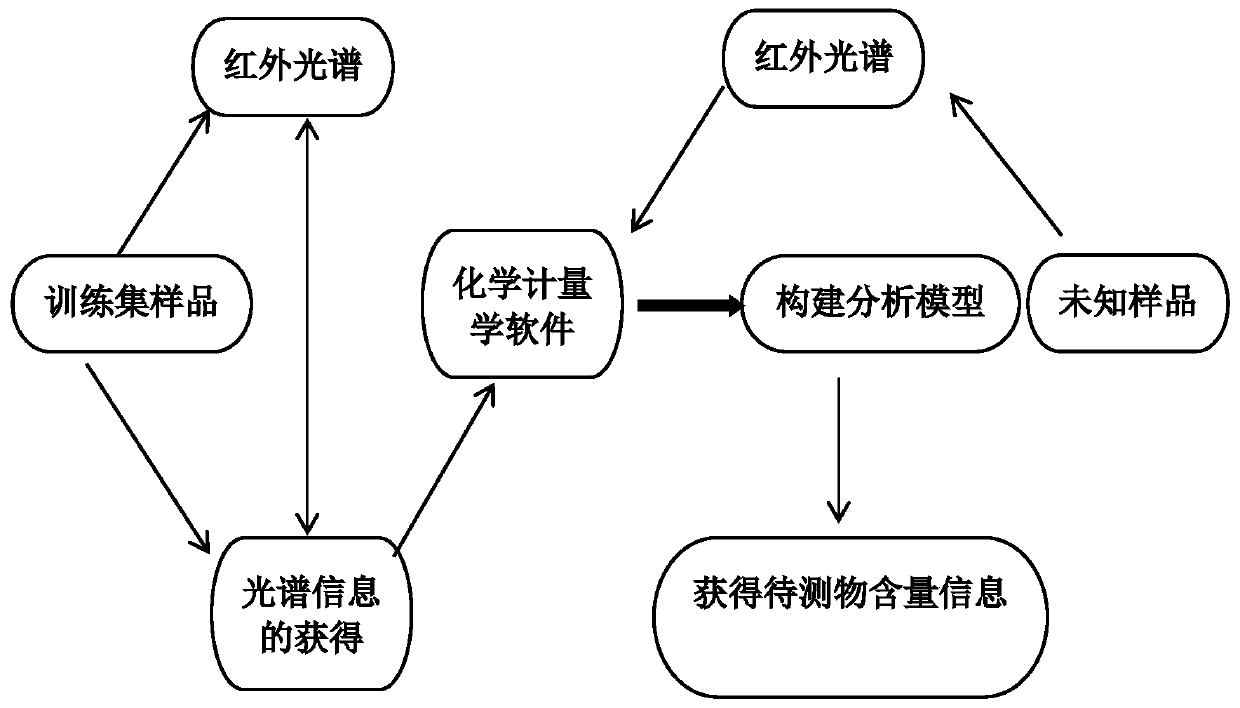
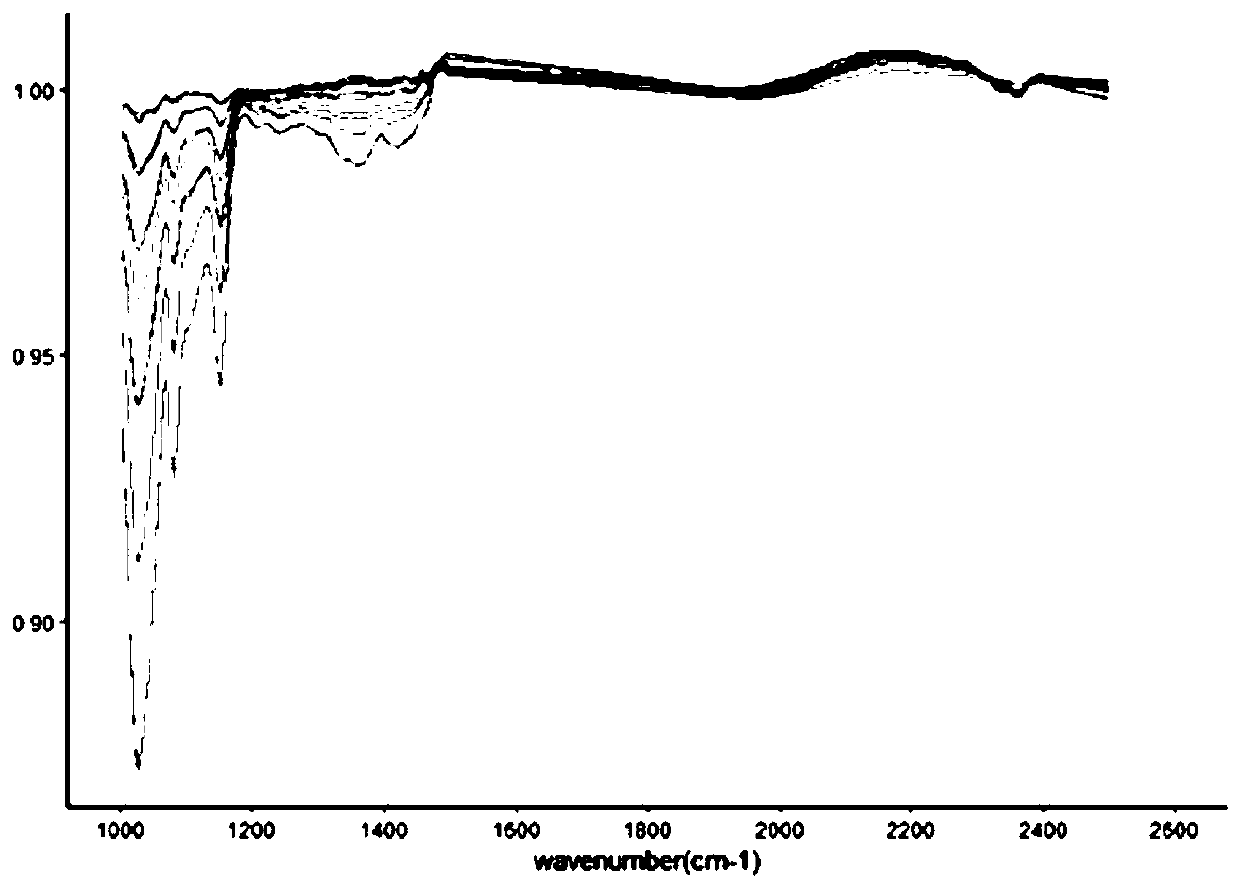
[0018] (2) Perform infrared spectrum analysis on the sample to obtain infrared spectrum data.
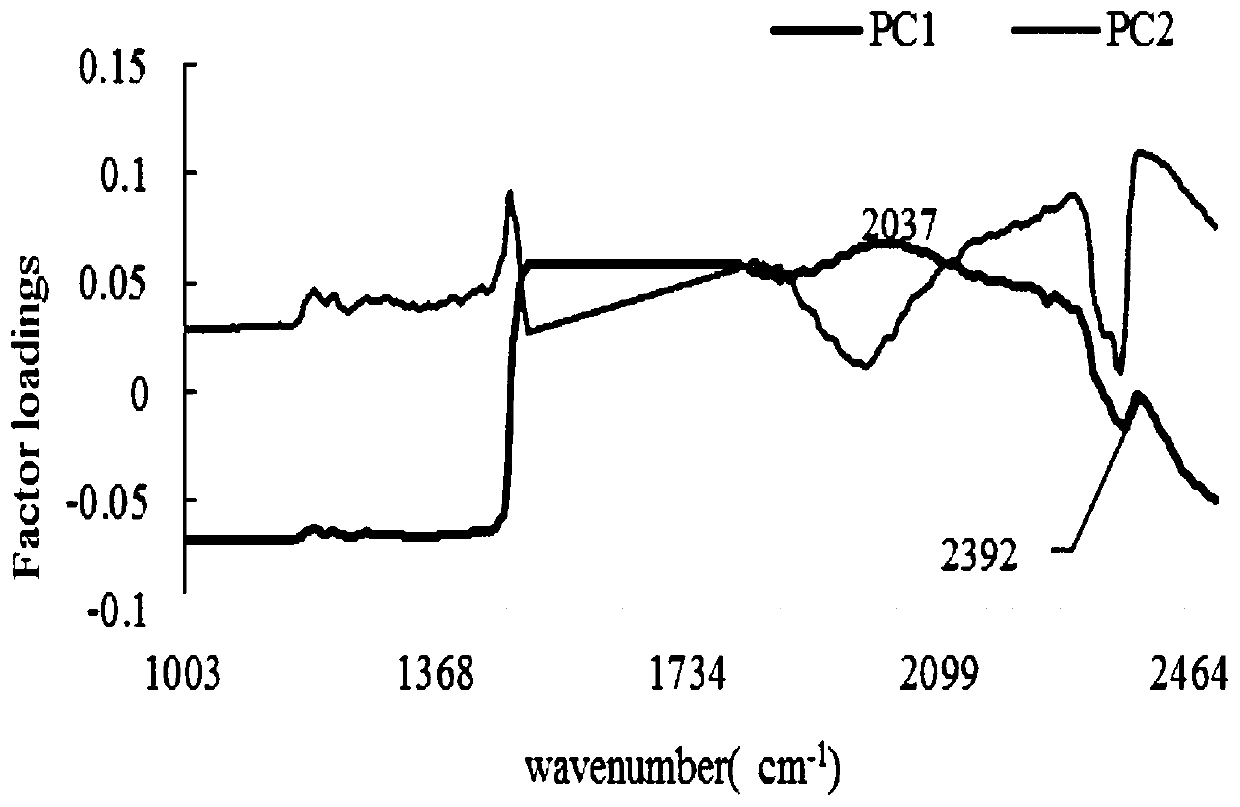
[0019] (3) Perform principal component analysis on the infrared spectrum data of the collected lactoferrin solutions at various concentrations, the cumulative contribution rate of the principal components PC1 and PC2 exceeds 80%, and use the principal component analysis to screen the wavenumber range corresponding to the absorption peak of the characteristic information.
[0020] (4) Process the spectral data corresponding to the selected wavenumbers with the first-order derivative preprocessing method, establish a PLS quantitative model, and obtain the model determination coefficient and the root mean square error of
Embodiment 2
[0023] (1) Taking whey protein solutions with mass concentrations of 1%, 2%, and 3% as the background, prepare 0.01%, 0.05%, 0.1%, 0.2%, and 0.3% mass concentrations of whey protein solutions with three different mass concentrations Lactoferrin standard sample solution.
[0024] (2) Perform infrared spectrum analysis on the sample to obtain infrared spectrum data.
[0025] (3) Perform principal component analysis on the infrared spectrum data of the collected lactoferrin solutions at various concentrations, the cumulative contribution rate of the principal components PC1 and PC2 exceeds 80%, and use the principal component analysis to screen the wavenumber range corresponding to the absorption peak of the characteristic information.
[0026] (4) Use the spectral data corresponding to the screened out wavenumbers by smoothing to establish a PLS quantitative model, and obtain the coefficient of determination of the model and the root mean square error of the model's prediction.
Embodiment 3
[0029] (1) Taking whey protein solutions with mass concentrations of 1%, 2%, and 3% as the background, prepare 0.01%, 0.05%, 0.1%, 0.2%, and 0.3% mass concentrations of whey protein solutions with three different mass concentrations Lactoferrin standard sample solution.
[0030] (2) Perform infrared spectrum analysis on the sample to obtain infrared spectrum data.
[0031] (3) Perform principal component analysis on the infrared spectrum data of the collected lactoferrin solutions at various concentrations, the cumulative contribution rate of the principal components PC1 and PC2 exceeds 80%, and use the principal component analysis to screen the wavenumber range corresponding to the absorption peak of the characteristic information.
[0032] (4) Using the preprocessing method of smoothing and first-order derivative to screen out the spectral data corresponding to the wave number, establish a PLS quantitative model, and obtain the model determination coefficient and the root mean
PUM
 Abstract
Description
Claims
Application Information
 - R&D Engineer
- R&D Manager
- IP Professional
- Industry Leading Data Capabilities
- Powerful AI technology
- Patent DNA Extraction
Browse by: Latest US Patents, China's latest patents, Technical Efficacy Thesaurus, Application Domain, Technology Topic.
© 2024 PatSnap. All rights reserved.Legal|Privacy policy|Modern Slavery Act Transparency Statement|Sitemap