Distribution line fault cause comprehensive probability analysis method

A technology of fault causes and distribution lines, which is applied in the direction of fault location and fault detection according to conductor type, can solve the problems of large investment in equipment, difficulty in identification and location of ground faults in distribution lines, etc., and achieve the effect of self-learning

Active Publication Date: 2019-03-26
GUIZHOU POWER GRID CO LTD
View PDF9 Cites 14 Cited by
  • Summary
  • Abstract
  • Description
  • Claims
  • Application Information

AI Technical Summary

Benefits of technology

This patented method analyzes lines from an electrical power system by analyzing their success or failure potential under different conditions such as current voltage levels, temperature changes, etc., along with previous experience about them. By comparing these results against previously established thresholds, it can identify any issues affecting signal transmission within the electricity grid. Based upon this knowledge, algorithms automatically learn new rules related to how well signals should behave when there're no problem at first. Overall, this approach provides technical benefits over conventional methods like time delays and manual inspections.

Problems solved by technology

This technical problem addressed in this patented text relates to improving the efficiency and reliability of analyzing lines used for electricity transmission systems (ECS). Traditional methods are limited because they rely heavily upon accurate measurements from distributed devices like meters or sensors that provide no immediate results when there's any damage caused during an event.

Method used


Image

  • Distribution line fault cause comprehensive probability analysis method
  • Distribution line fault cause comprehensive probability analysis method
  • Distribution line fault cause comprehensive probability analysis method

Examples


Embodiment 1

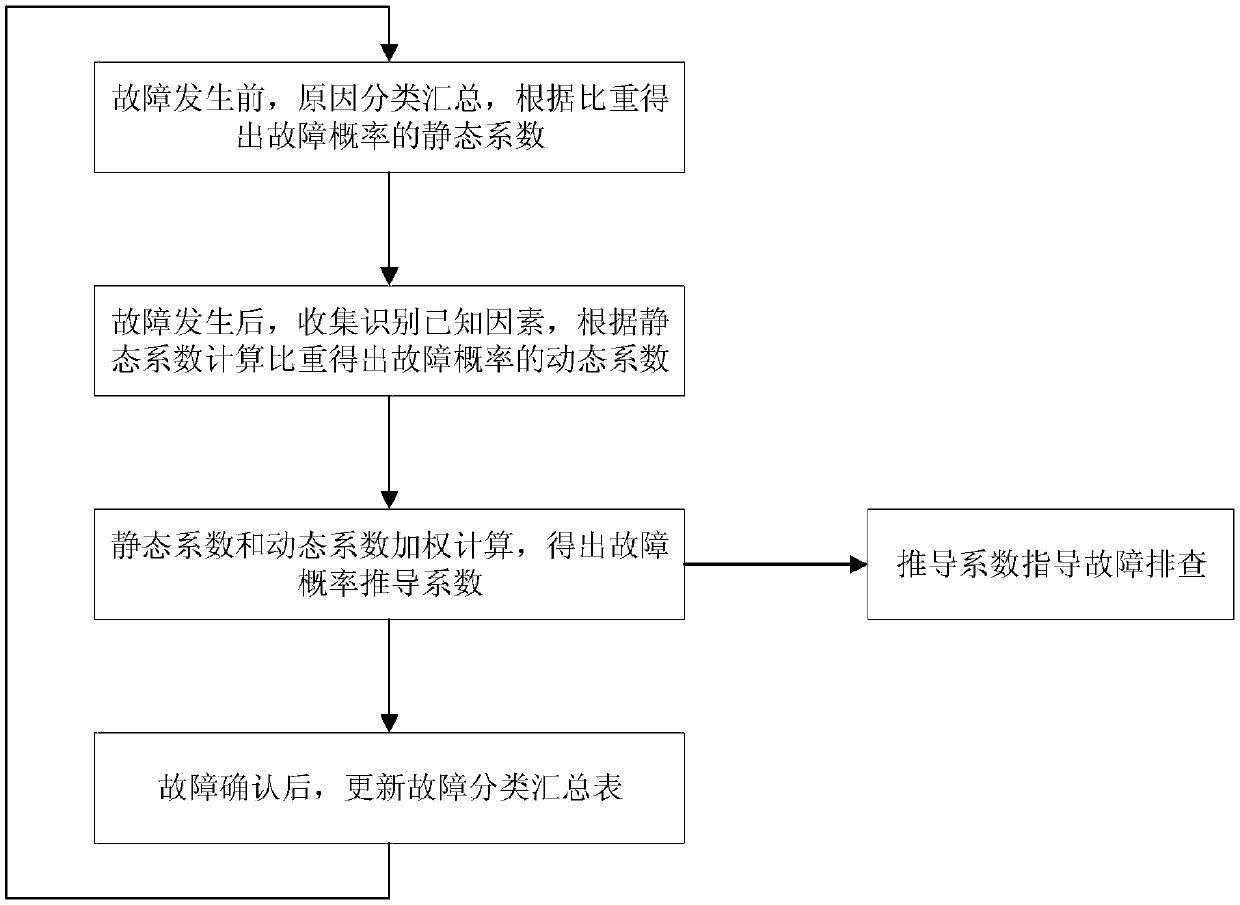
[0013] Embodiment 1: as figure 1 As shown, a method for comprehensive probability analysis of distribution line fault causes, the method includes the following steps:

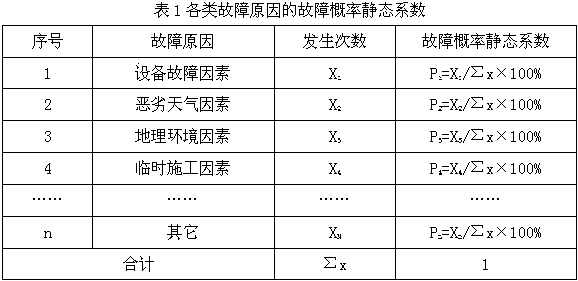
[0014] Step 1. According to the category of distribution line fault causes, classify and summarize the times of all fault causes that have occurred in the historical period that can be recorded in the set area, form a set of empirical values ​​of fault causes, and calculate the proportion of various fault causes , defined as the static coefficient of the failure probability;

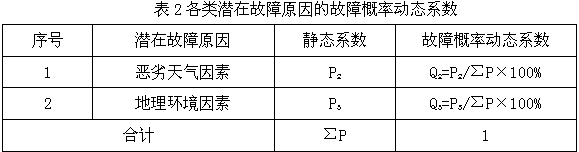
[0015] Step 2. When a distribution line fault occurs, collect and identify known potential factors and summarize them to form a potential value set of the current fault cause, calculate the proportion of such fault factors according to its static coefficient, and define it as the dynamic coefficient of the fault probability;

[0016] Step 3. After weighting the dynamic coefficient and static coefficient of the failure probability, resummari


PUM


Abstract

The invention discloses a distribution line fault cause comprehensive probability analysis method. The method comprises the following steps of: taking all causes which may cause line faults as analysis criteria; referring to the causes of the previous faults of a power distribution network in the region as empirical values; carrying out static coefficient assignment according to the historical occurrence probability; when a fault occurs, carrying out dynamic coefficient assignment according to known factors, carrying out probabilistic sorting on causes which may cause the faults through weighted calculation of static coefficients and dynamic coefficients, performing circulation once after power distribution line fault removal and confirmation, and updating the static coefficients of the fault probability repeatedly in this way. According to the method, a preliminary fault cause analysis conclusion can be obtained and used for guiding line inspectors to find fault points with emphasis;the static coefficient assignment is further corrected according to actual fault causes after troubleshooting is finished, and therefore self-learning of the algorithm is achieved, and more accurate data is provided for later fault probability judgment.

Description


Claims


Application Information

Patent Timeline
Owner GUIZHOU POWER GRID CO LTD
Why Eureka
Try Eureka