Color spectral imaging

Inactive Publication Date: 2006-01-31
CHOI J RICHARD
View PDF4 Cites 21 Cited by
  • Summary
  • Abstract
  • Description
  • Claims
  • Application Information

AI Technical Summary

Benefits of technology

[0009]In the present invention, each color band in the color spectrum exhibits a range of opacity, such that 100% opacity is mapped onto the top portion of the predetermined sub-range value and the color opacity tapers down to the bottom of each sub-range. To prevent a sharp color change between different color boundaries, adjacent color bands can be smoothly blended over a short HU range with a blending filter to form a smoothly varying, contin

Problems solved by technology

This presents a serious problem in interpreting computed images, because human eyes cannot discern over 5000 distinct shades of gray.
Since multiple viewing windo

Method used


Image

  • Color spectral imaging
  • Color spectral imaging
  • Color spectral imaging

Examples


Embodiment Construction

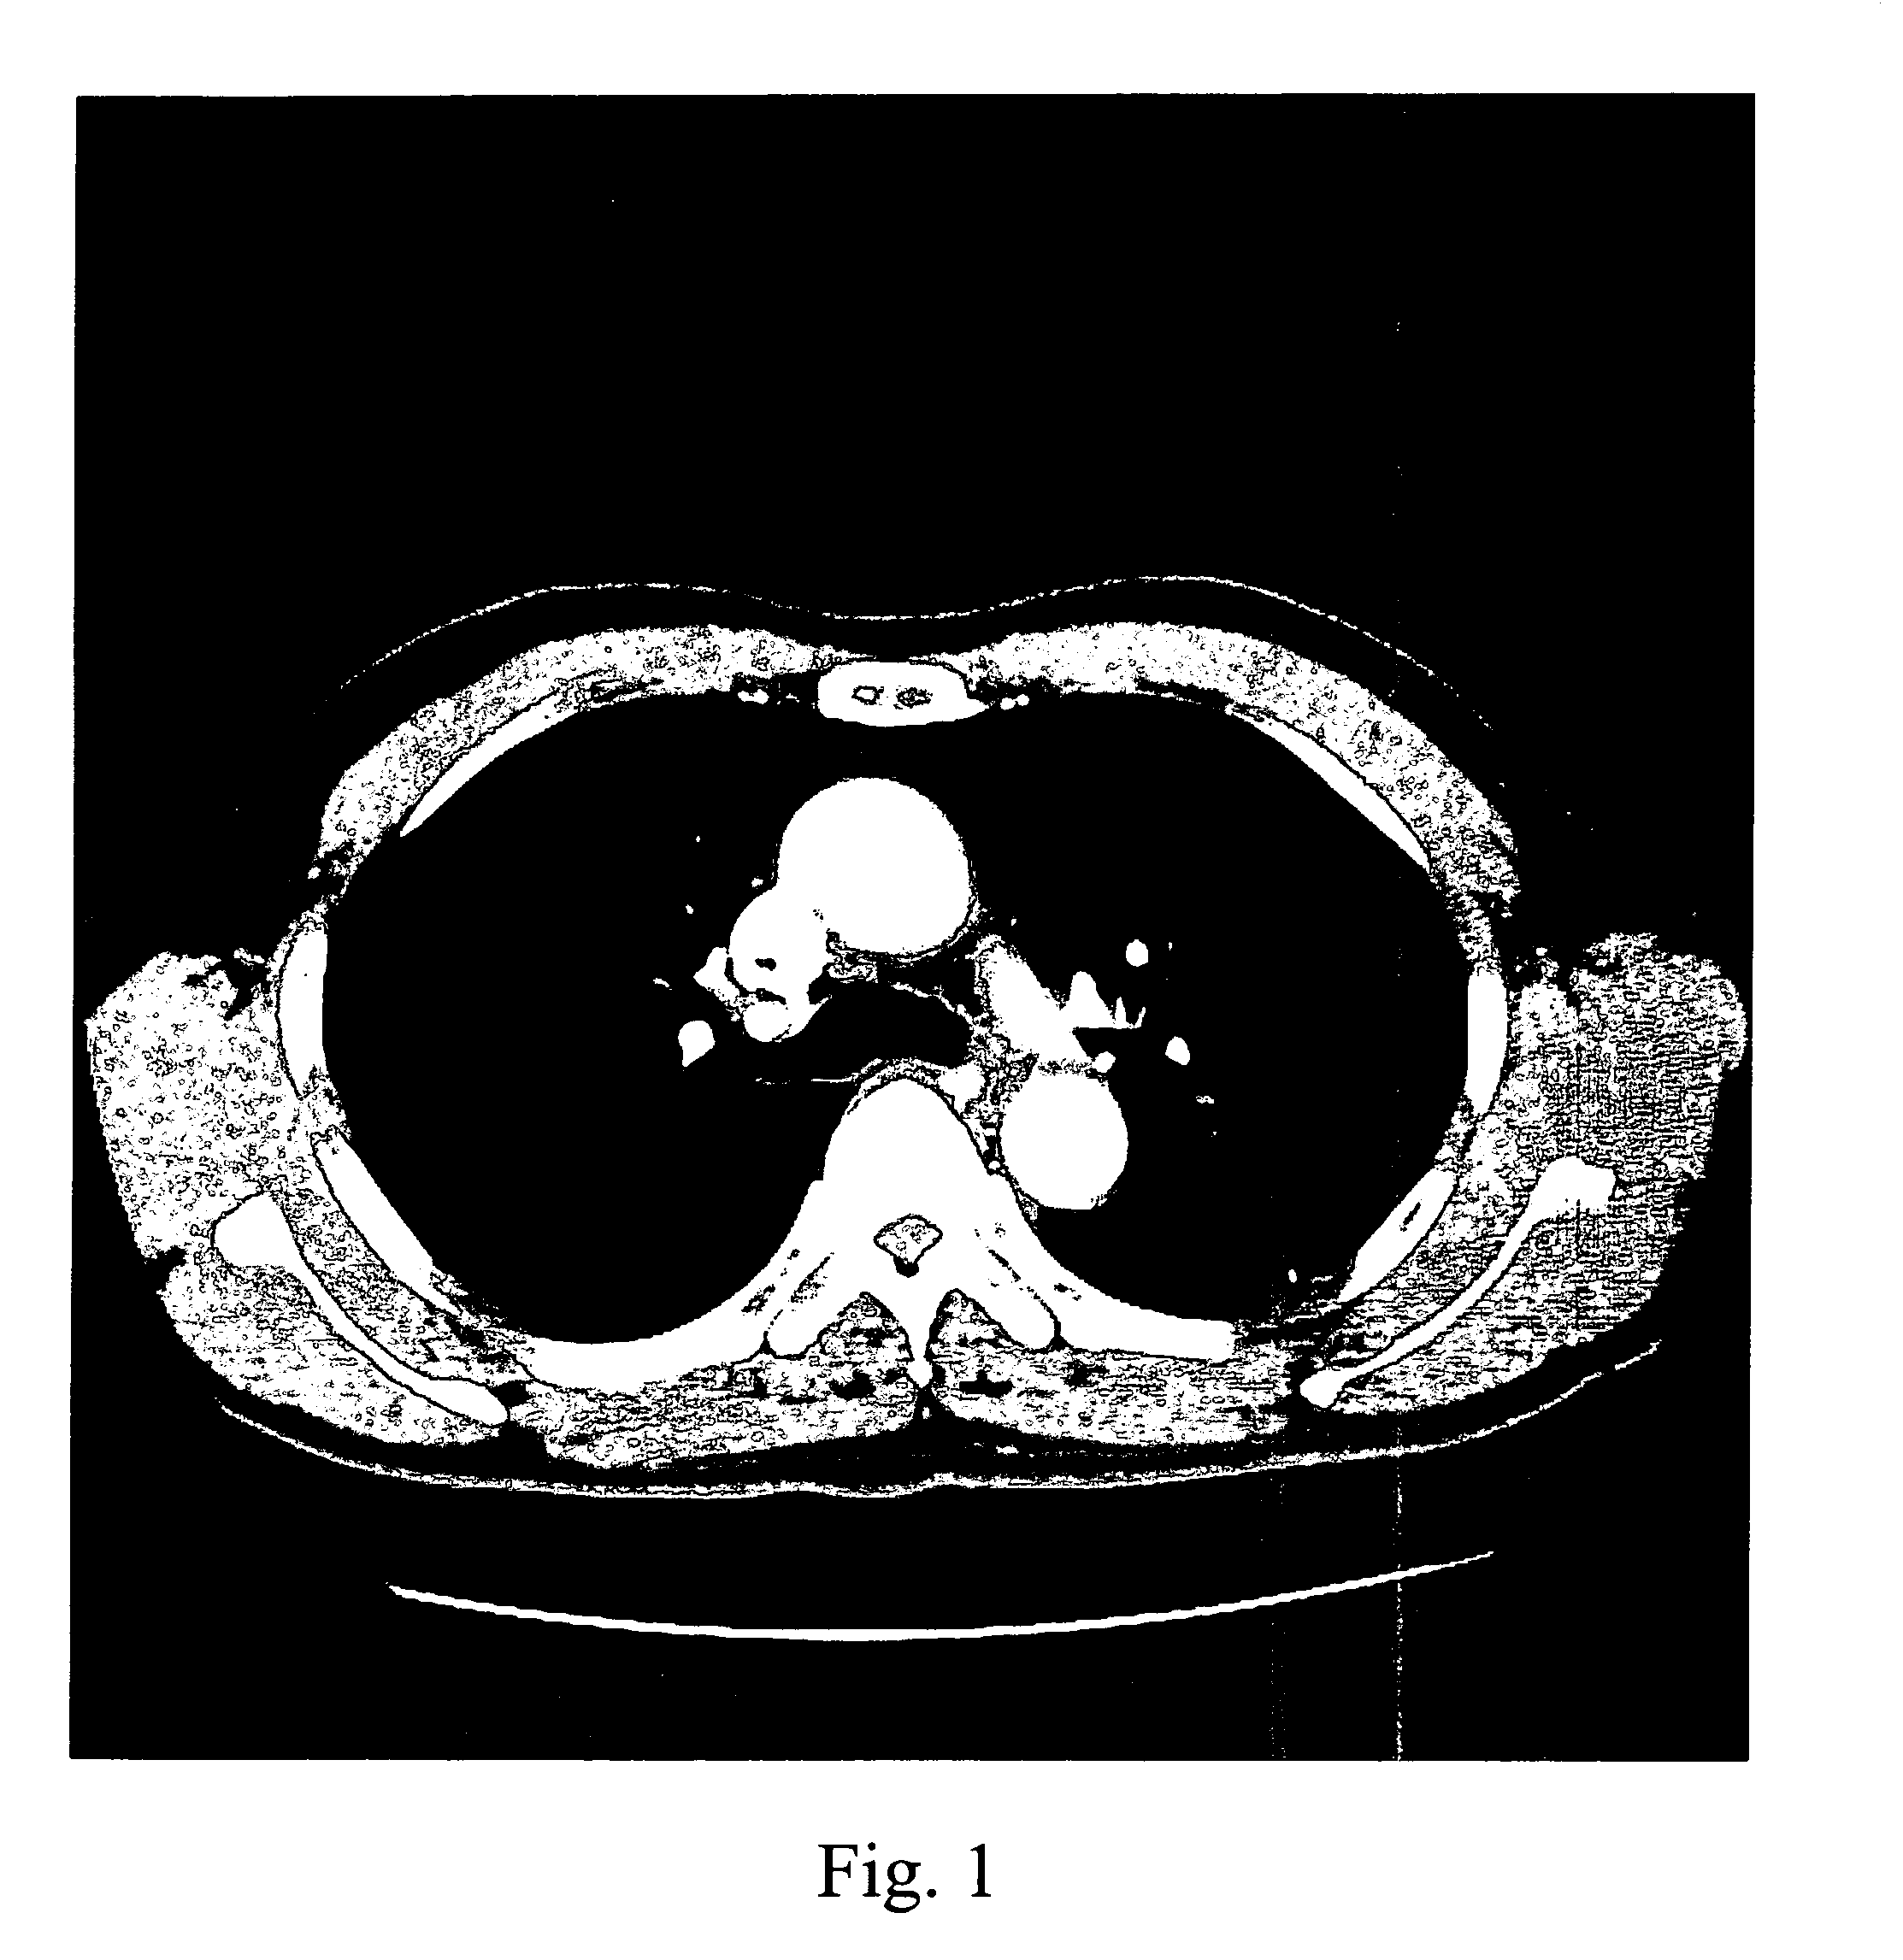
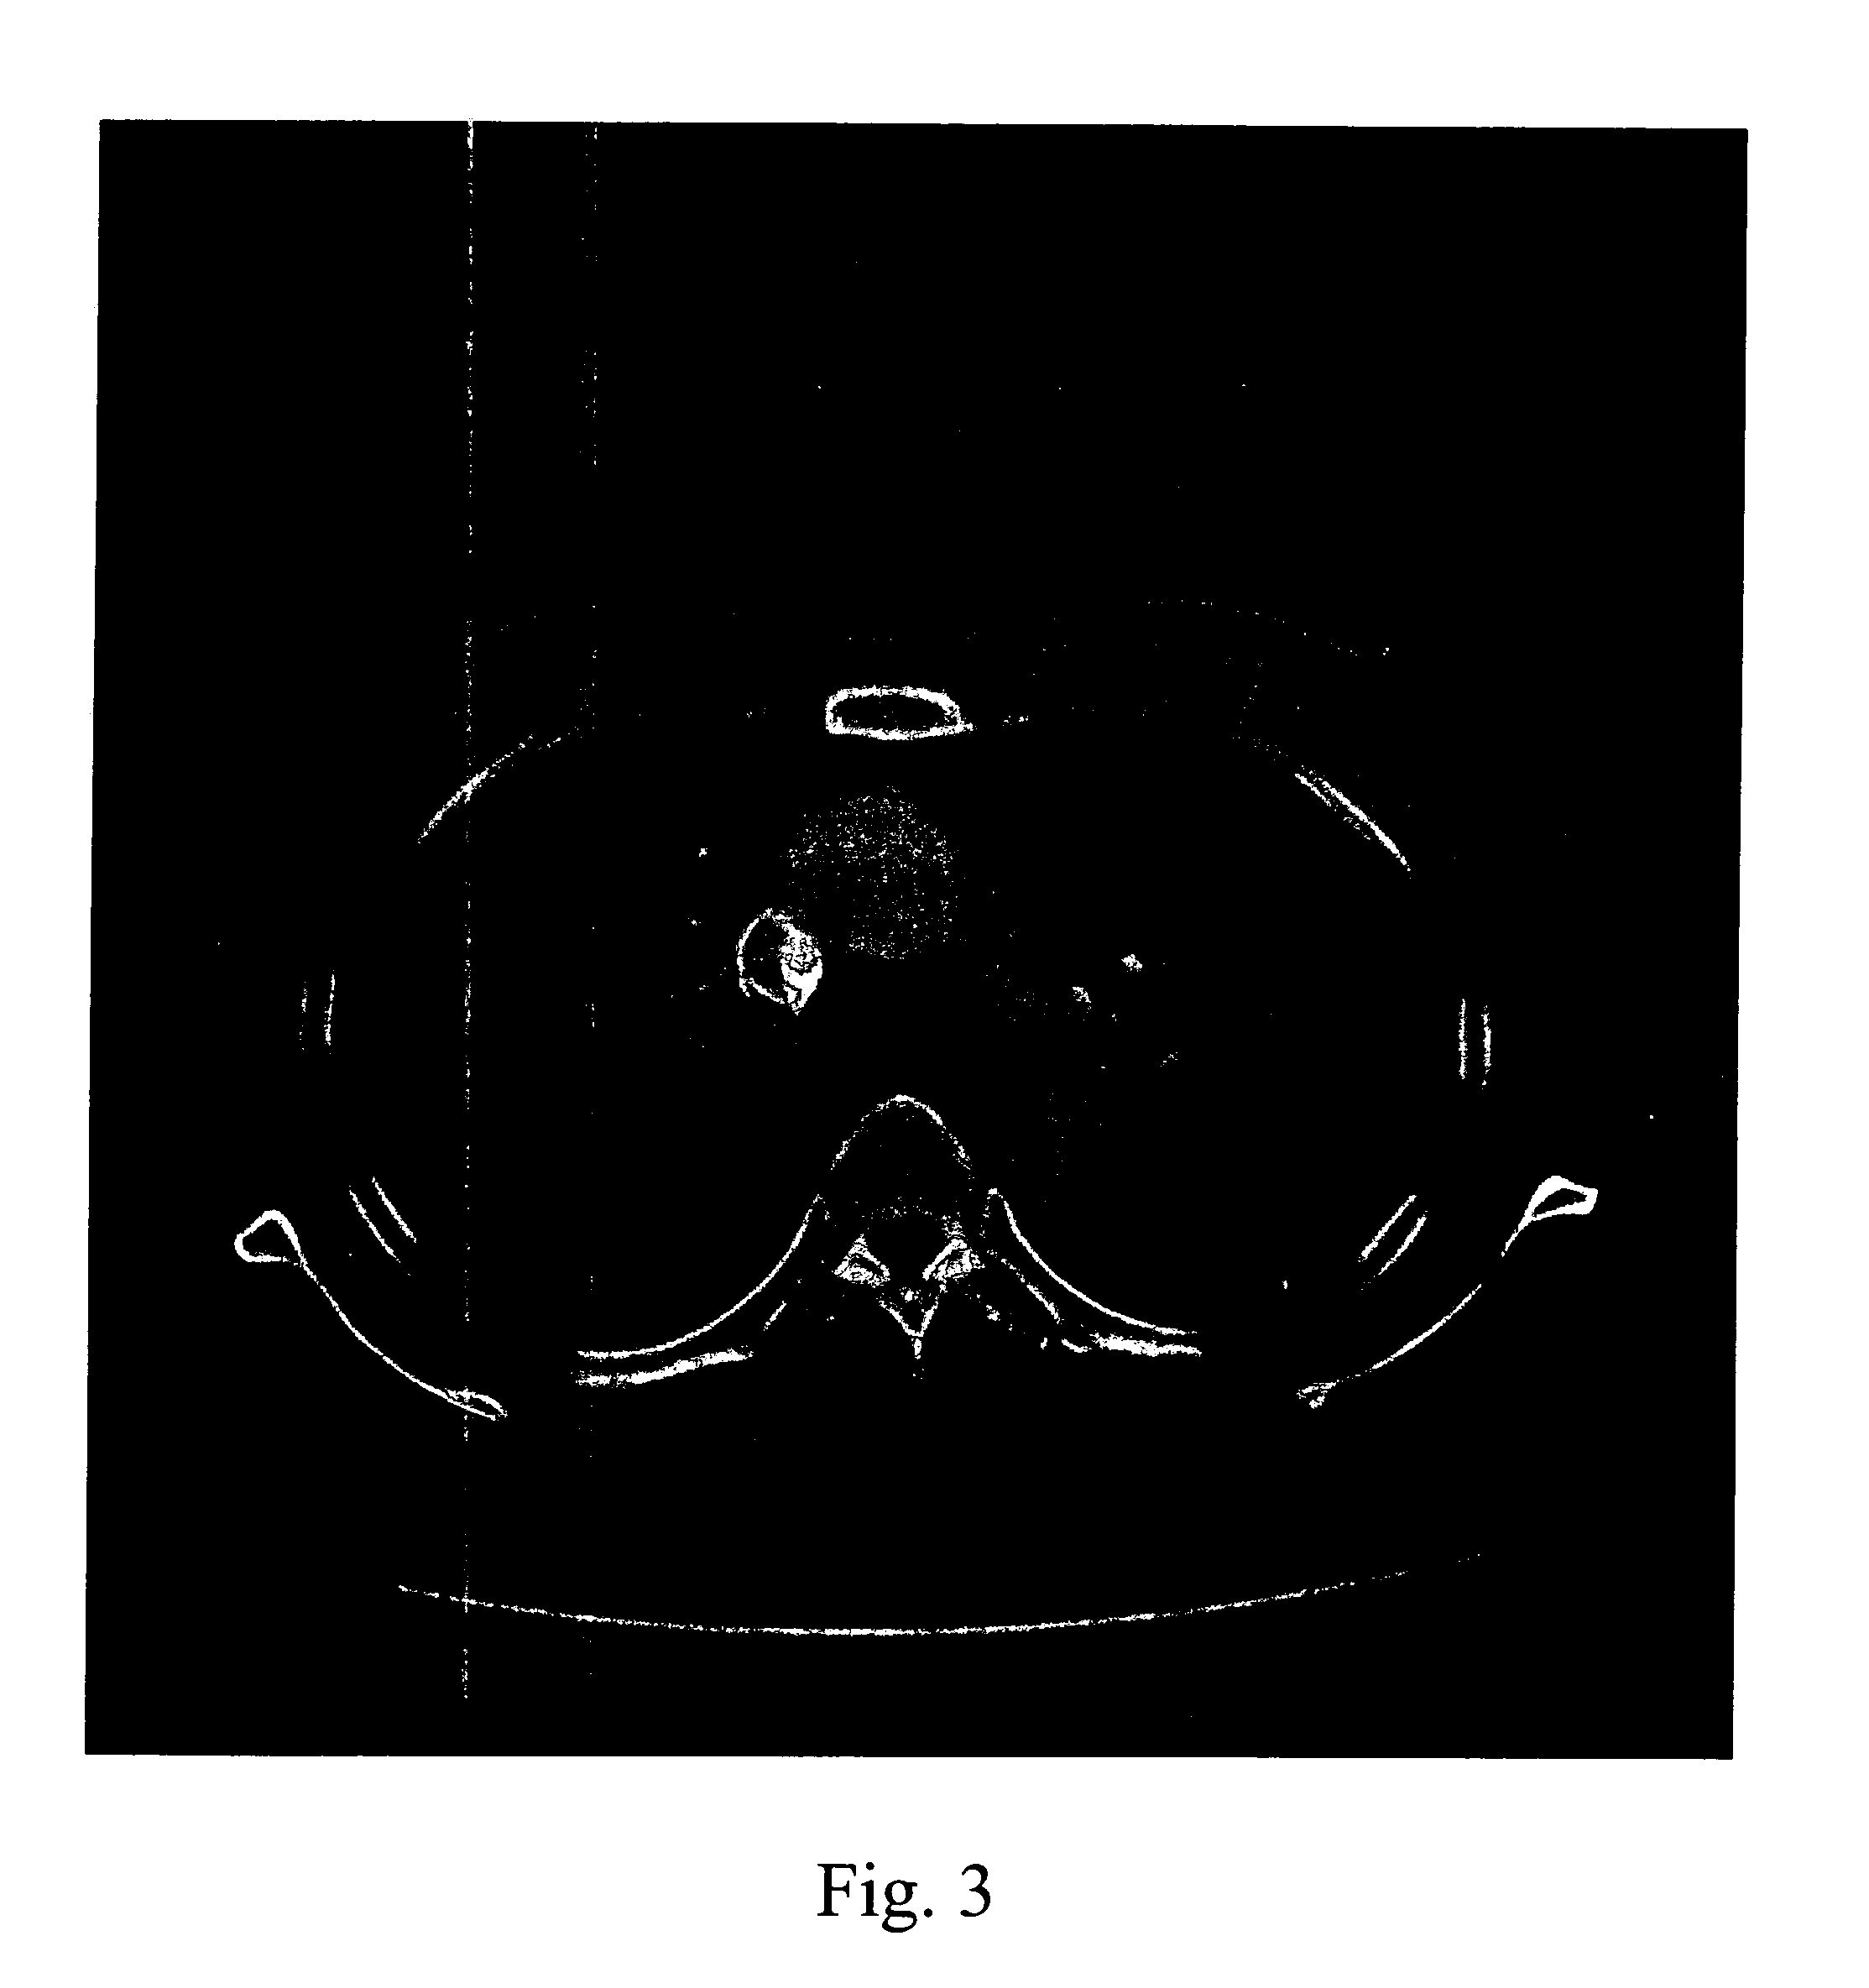
[0017]FIG. 4 shows a computed tomography image that has been colorized by the inventive method. The displayed anatomical region is the same as that of FIGS. 1–3, but all the internal organs and tissues are displayed together and readily discernible through the use of colors. The method of the present invention utilizes standard two-dimensional CT scan data in DICOM (Digital Image and Communications in Medicine) format, and requires no other pre-processing. The two-dimensional DICOM scan data contains relative radiologic density values of anatomical region of interest. The present invention employs a method of mapping a color spectrum comprising plurality of color bands onto a two-dimensional CT scan data, such that a predetermined sub-range of density value is represented with a unique color band of the color spectrum.

[0018]FIG. 4 illustrates an exemplary embodiment of the color spectrum 1 displayed on the right side of the computed image. The color band on the bottom of the spectrum 2


PUM


Abstract

The present invention, called Color Spectral Imaging (CSI), generally pertains to a method of displaying colorized two-dimensional medical images of human anatomy. Specifically, the present invention pertains to a method of assigning predetermined range of colors to computed tomography images for enhanced visualization.

Description


Claims


Application Information

Patent Timeline
Owner CHOI J RICHARD
Why Eureka
Try Eureka