Fluorescent probe responsive to both peroxynitroso anion and viscosity as well as preparation and application thereof
A fluorescent probe, dual-response technology, applied in the field of fluorescent probe detection, can solve problems such as the inability to meet the biological correlation of various analytes, and achieve the effects of quantitative detection, novel structure and simple synthesis
- Summary
- Abstract
- Description
- Claims
- Application Information
AI Technical Summary
Benefits of technology
Problems solved by technology
Method used
Image

Examples
Embodiment 1
[0046] Example 1: Preparation of Probe (I)
[0047]
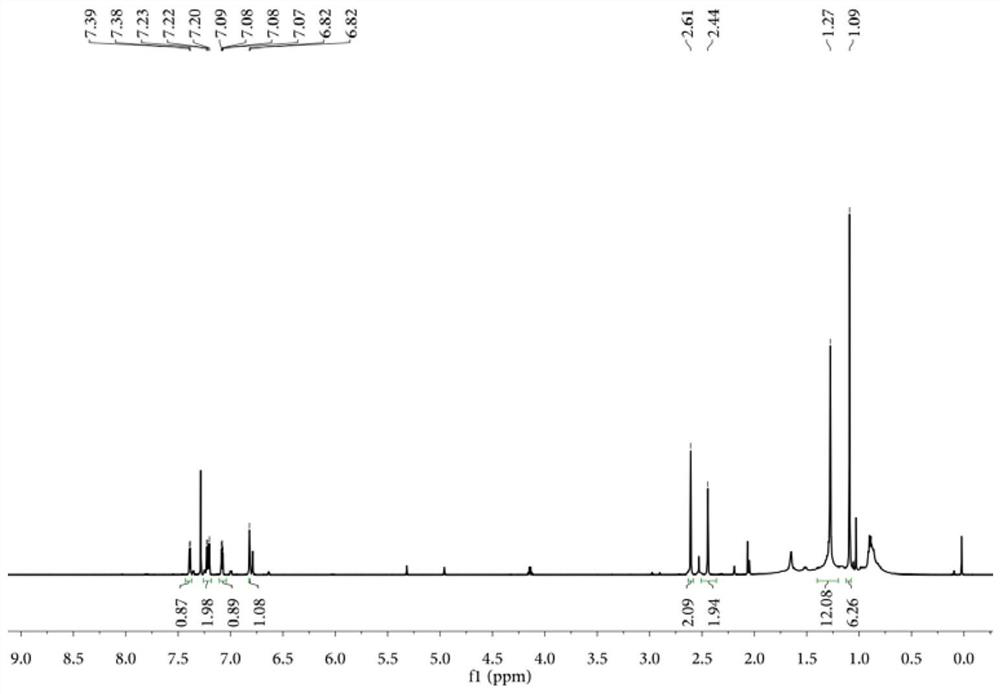
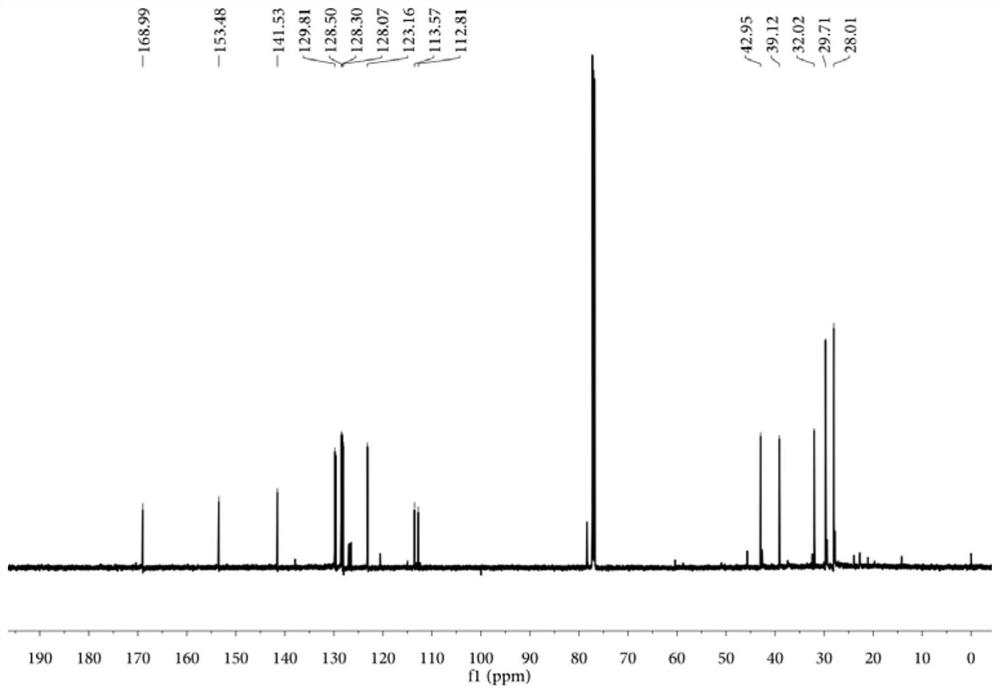
[0048] In a nitrogen atmosphere, compound 2, compound 3 and sodium methoxide were added to acetonitrile solvent, and the ratio of compound 2, compound 3 and sodium methoxide was 1:1.5:0.3, wherein compound 2 was 1 mmol, and the amount of acetonitrile was 10 mL , the reaction was stirred at 45 °C for 12 h, the reactant was concentrated under reduced pressure, and purified by silica column chromatography using ethyl acetate / petroleum ether (v / v, 1:5) to obtain probe (I) ( yield 27%), and its hydrogen NMR spectrum can be found in figure 1 , see C NMR figure 2 .
[0049] 1 H NMR (600MHz, CDCl 3 )δ7.39(d,J=5.0Hz,1H),7.24-7.20(m,2H),7.08(dd,J=5.0,3.7Hz,1H),6.82(d,J=2.6Hz,1H), 2.61(s, 2H), 2.44(s, 2H), 1.27(s, 12H), 1.09(s, 6H).
[0050] 13 C NMR (151MHz, CDCl 3 )δ168.99,153.48,141.53,129.81,128.50,128.30,128.07,123.16,113.57,112.81,42.95,39.12,32.02,29.71,28.01.
Embodiment 2
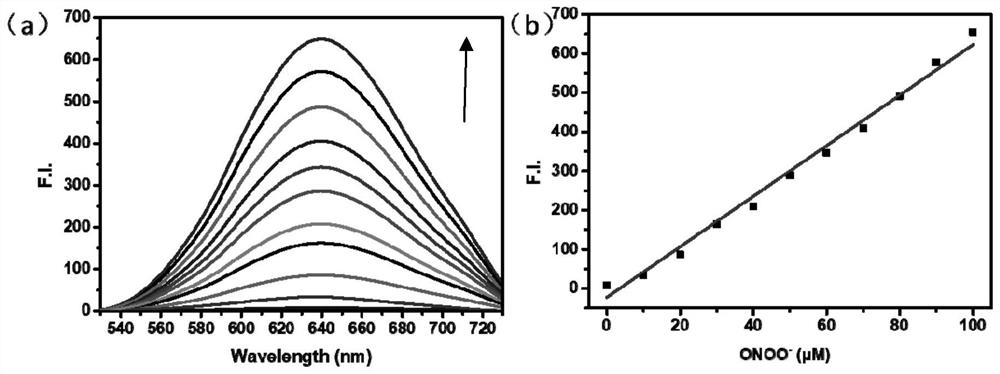
[0051] Example 2: Probe (I) to different ONOO - Fluorescence emission performance test of concentrated solutions.
[0052] Accurately weigh a certain amount of probe (I) (prepared in Example 1), prepare a probe stock solution with a concentration of 1 mM in dimethyl sulfoxide, and add 2.5 μL to 0.5 mL of PBS buffer (10 mM) with a pipette. , pH 7.4), add 5 μL ONOO of different concentrations respectively - Aqueous solution, after reacting at 37°C for 10 minutes, at the excitation wavelength of 490nm, measure the fluorescence value of the probe, statistical data, and investigate the relationship between the fluorescence value and ONOO - The linear relationship between the two concentrations.
[0053] Fluorescence spectra at different emission wavelengths are shown in image 3 in (a). The data show that at the excitation wavelength of 490 nm, with ONOO in the buffer - As the concentration increased, the fluorescence intensity of probe (I) gradually increased. At the same time,
Embodiment 3
[0054] Example 3: Fluorescence emission performance test of probe (I) to solutions with different viscosity values.
[0055] Accurately weigh a certain amount of probe (I) (prepared in Example 1), prepare a probe mother solution with a concentration of 1 mM with dimethyl sulfoxide, pipette 20 μL and add it to 4 mL of PBS-glycerol with different viscosity values. solution (pH 7.4), after mixing, ultrasonication and standing, added to the fluorescence cuvette, at the excitation wavelength of 410nm, the fluorescence value of the probe was measured, statistical data, and both fluorescence value and viscosity value were investigated conversion relationship.
[0056] Fluorescence spectra at different emission wavelengths are shown in Figure 4 in (a). The data showed that with the increase of buffer viscosity, the fluorescence intensity of probe (I) gradually increased with the increase of the mixture concentration at the excitation wavelength of 410 nm. At the same time, at the emi
PUM
| Property | Measurement | Unit |
|---|---|---|
| Viscosity | aaaaa | aaaaa |
Abstract
Description
Claims
Application Information
 - R&D Engineer
- R&D Manager
- IP Professional
- Industry Leading Data Capabilities
- Powerful AI technology
- Patent DNA Extraction
Browse by: Latest US Patents, China's latest patents, Technical Efficacy Thesaurus, Application Domain, Technology Topic.
© 2024 PatSnap. All rights reserved.Legal|Privacy policy|Modern Slavery Act Transparency Statement|Sitemap